Fabio Crameri
batlow scientific color palette by Fabio Crameri
The Scientific colour map
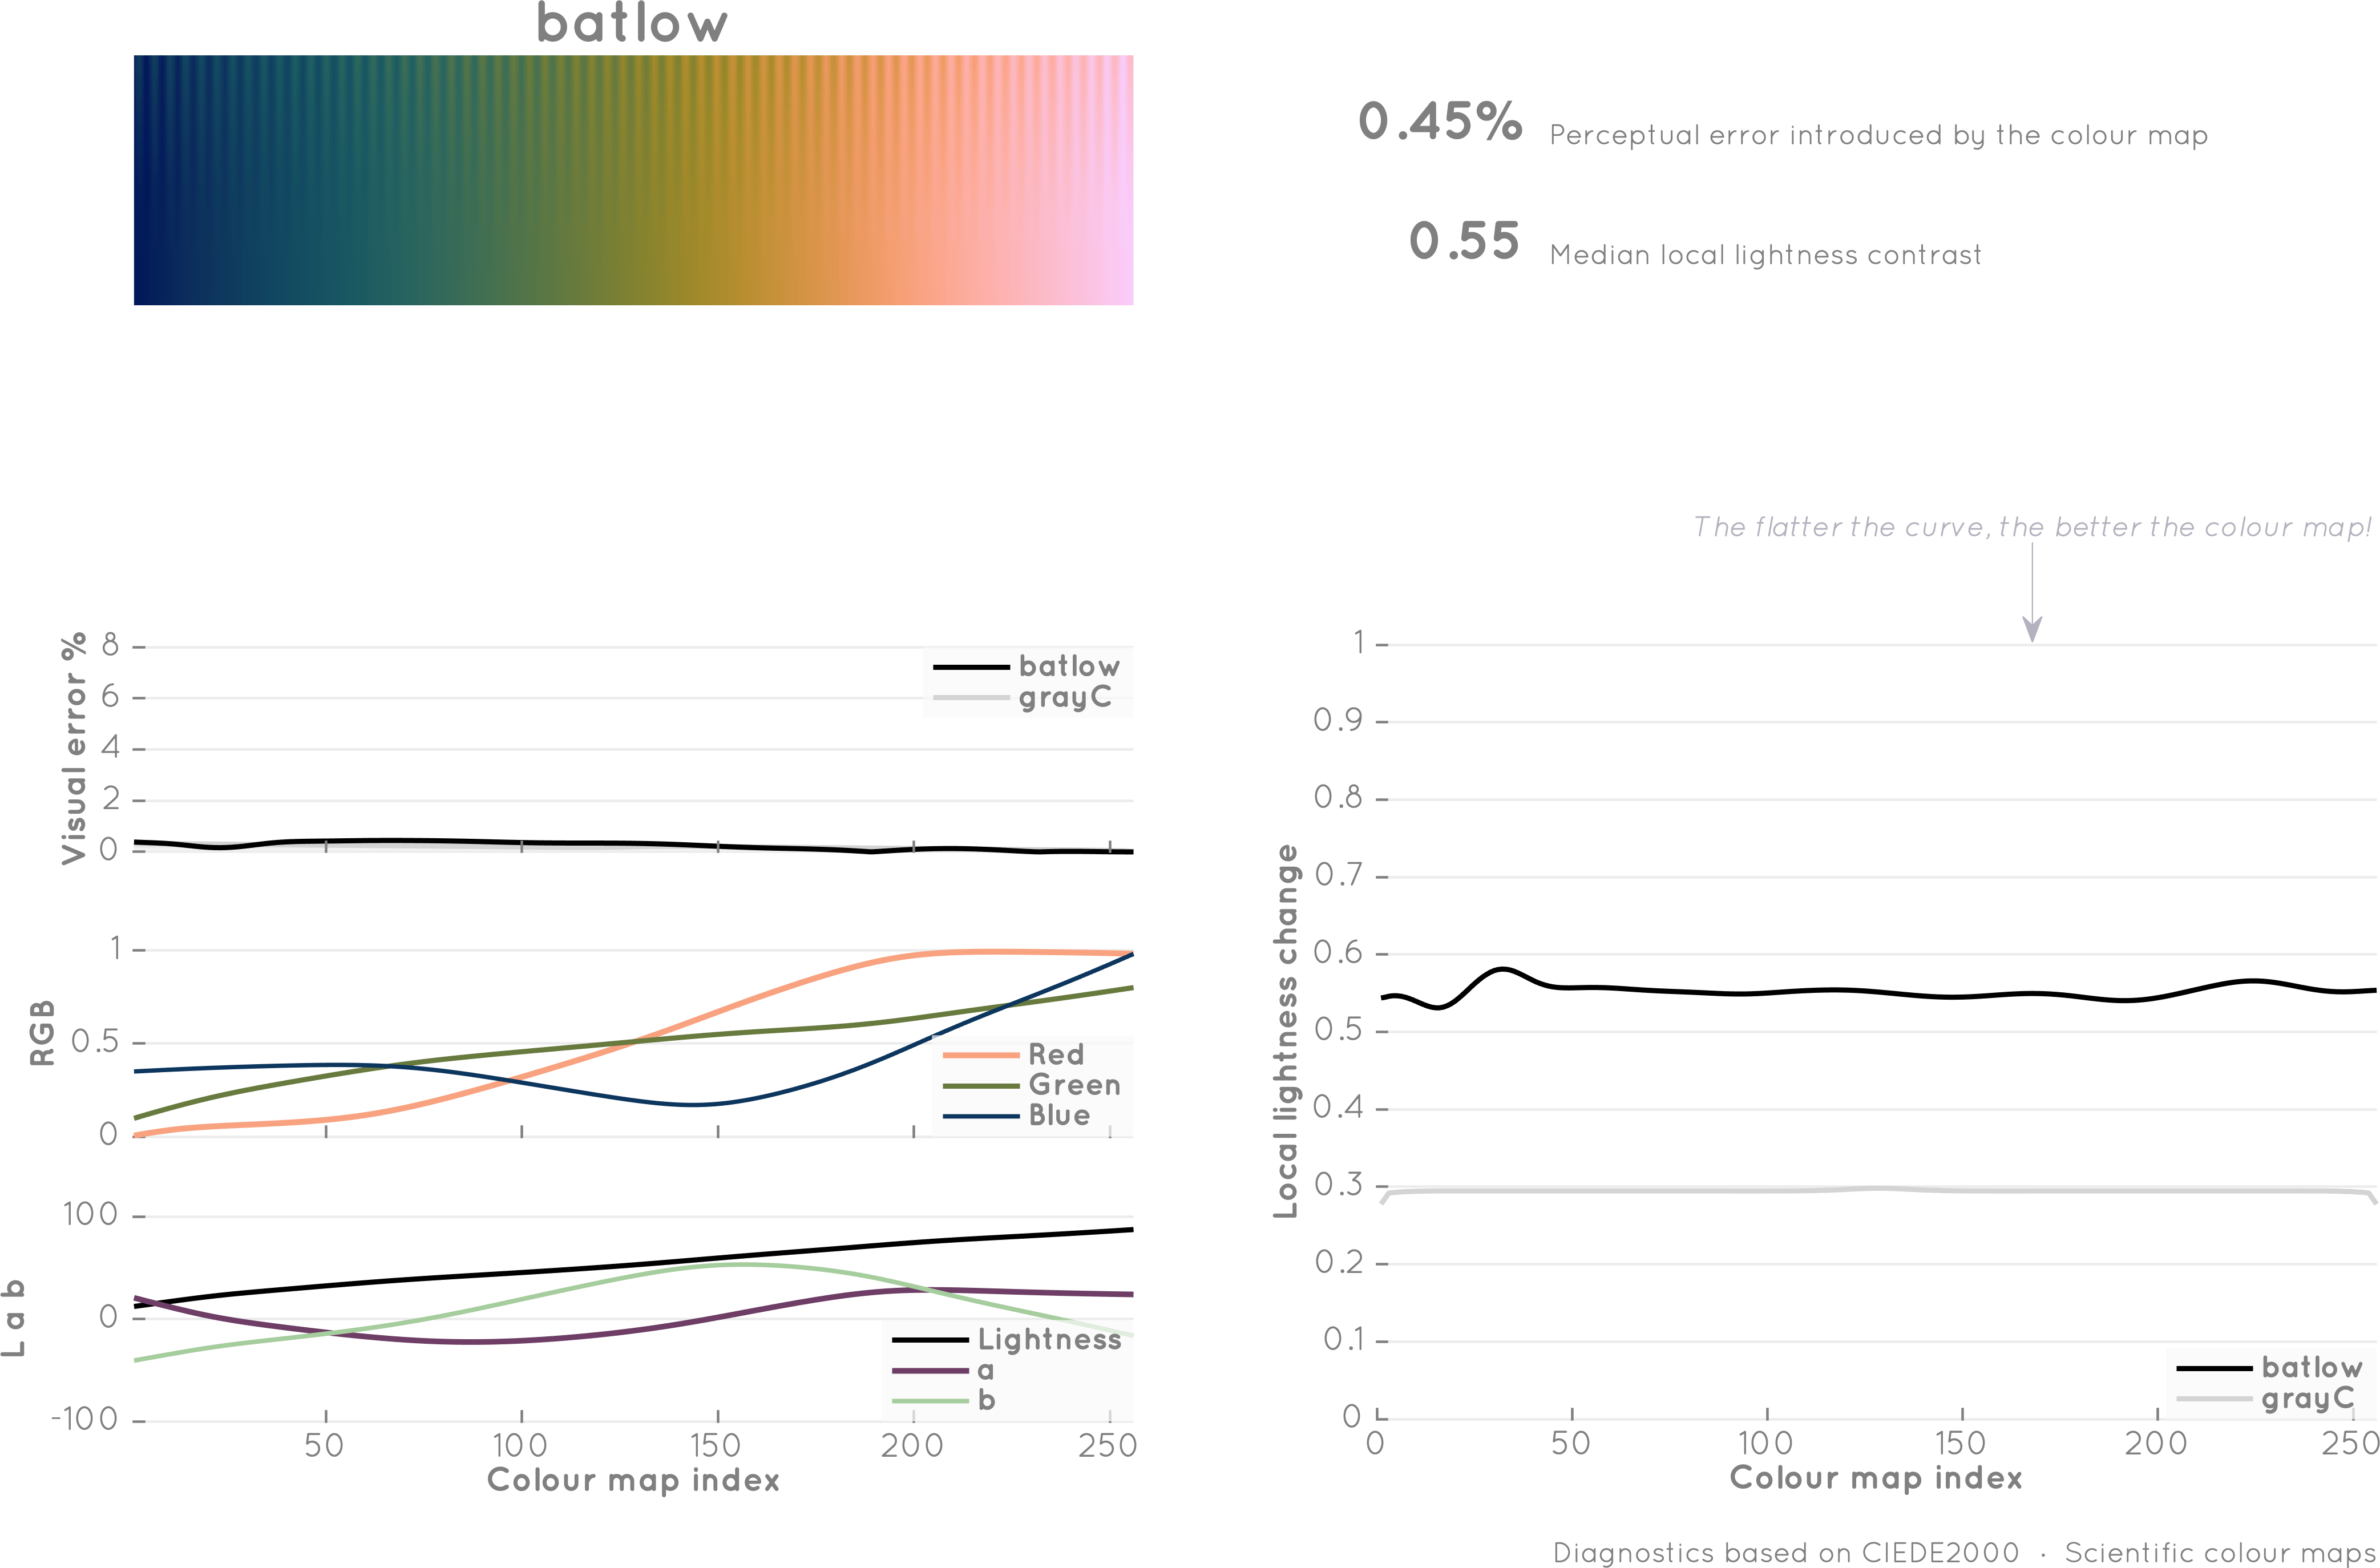
batlow

  • Perceptually uniform ✔︎
  • Perceptually ordered ✔︎
  • Colour-vision-deficiency friendly ✔︎
  • Readable as black-and-white print ✔︎
  • Provided in all major formats ✔︎
  • Sequential
  • No white; no black
  • The scientific rainbow

Also available as:

batlowW scientific color palette by Fabio Crameri

batlowW

Fantastic to highlight data on light background.

  • Sequential
  • White-ended
batlowK scientific color palette by Fabio Crameri

batlowK

Fantastic to highlight data on dark background.

  • Sequential
  • Black-ended
batlow10 discrete scientific color palette by Fabio Crameri

batlow10  (or batlow25)

Convenient to pinpoint local data-value ranges.

  • Discrete
batlowS categorical scientific color palette by Fabio Crameri

batlowS  (or batlowWS & batlowKS)

Your best choice for categorical data such as line or scatter plots.

batlow

Scientific diagnostics

The figure shows the colour map with low gradient ripples to indicate how it represents low-contrast regions in different locations of the colourbar, and a plot of the lightness difference, dE, indicating better perceptual-uniformity the flatter the curve.

→ Compare to the diagnostics of the rainbow (a.k.a. jet) colour map.

Diagnostics performed after Kovesi, P. (2015), Good colour maps: How to design them, CoRR, abs/1509.03700 and based on MatLab scripts from Peter Kovesi.

Scientific diagnostics of the batlow colour map by Fabio Crameri